Peter Schiff Warns of S&P 500 Crash Risk as Market Breadth Weakens Near Record Highs

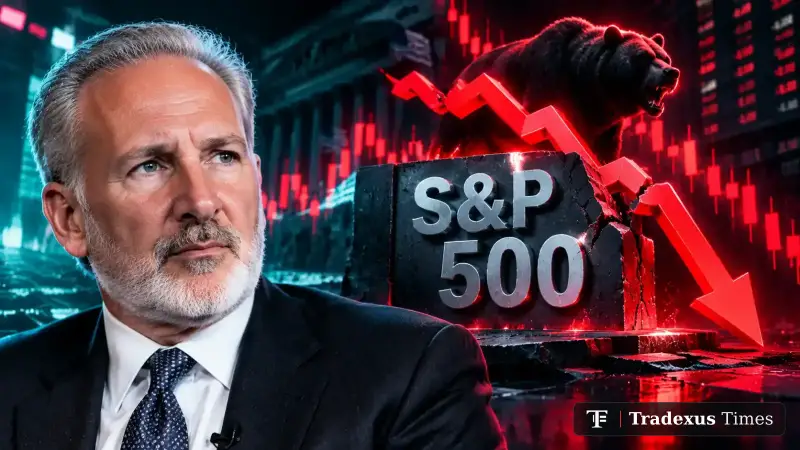
Peter Schiff warns that weak S&P 500 breadth could signal greater downside risk, with 430 constituents averaging 21.7% below their highs despite the index trading near a record.

By Tradexus Times Team 2 min read
Summarize this story3 key points · 20-second readThe key points in 20 seconds
  • Peter Schiff warns that weak S&P 500 breadth signals rising downside risk despite the index near record highs.
  • 430 constituents average 21.7% below their peaks, indicating approximately 86% of stocks are in bear-market territory.
  • Schiff compares current conditions to 1973 and 1999-2000, noting similar weak breadth preceded major downturns.

Why it matters: The article explains how narrow market participation by large tech companies masks broader weakness, which could threaten the rally's durability if sentiment deteriorates.

Summary written with AI from this article.

Peter Schiff Warns of S&P 500 Crash Risk as Market Breadth Weakens Near Record Highs

Economist Peter Schiff has warned that deteriorating market breadth beneath the S&P 500’s near-record performance could signal rising downside risk, pointing to a growing disconnect between the benchmark index and the majority of its constituent stocks.

In an X post on September 26, Schiff said the S&P 500 was trading just 0.7% below its all-time high, while 430 companies in the index remained an average of 21.7% below their individual peaks. He argued that this divergence indicates that approximately 86% of S&P 500 stocks are in bear-market territory.

Schiff compared the current market structure with January 1973 and the 1999–2000 dot-com period, claiming that similarly weak breadth preceded major downturns in both instances. During those historical episodes, the S&P 500 subsequently lost close to half its value. However, these comparisons reflect Schiff’s interpretation of historical patterns and do not establish that the index will experience a similar decline in the current cycle.

The central issue is market breadth, which measures how widely gains are distributed across an index. When a relatively small group of companies accounts for a disproportionate share of market gains, the headline index can remain strong even as many individual stocks underperform. This divergence can make the market’s overall performance appear healthier than the broader participation suggests.

Large technology companies, including Nvidia and Apple, have contributed significantly to the S&P 500’s recent performance because of their substantial market capitalizations. By contrast, the equal-weighted S&P 500, which assigns the same weight to each constituent, has underperformed its capitalization-weighted counterpart in recent weeks. This difference highlights the extent to which index performance can depend on a limited number of market leaders.

Other indicators cited in the broader market discussion include a declining share of S&P 500 constituents trading above their 50-day and 200-day moving averages. Rising Treasury yields and widening credit spreads have also been identified as potential sources of pressure if investor sentiment toward leading technology stocks deteriorates.

Schiff’s warning is consistent with his longstanding concerns about elevated asset valuations, inflation, government debt, and the U.S. economic outlook. He has also advocated precious metals, particularly gold and silver, as defensive assets. These views form part of his broader bearish market outlook rather than evidence that a crash is imminent.

The outlook remains contested. Some market observers argue that the current concentration of index performance reflects the growing influence of passive investment strategies and the profitability of major technology companies, making direct comparisons with previous market cycles less straightforward.

Investors will therefore be watching whether market participation improves, whether the equal-weighted index begins to close its performance gap, and whether weakness among individual stocks spreads to the largest constituents. A sustained deterioration in these measures could increase concerns about the durability of the S&P 500’s rally, while improving breadth would suggest that gains are becoming more widely distributed.


Share
Newsletter

Get the Tradexus Briefing

The day’s most important crypto stories in one short email, once a day. Free — unsubscribe any time.

About the authorTradexus Times Team

The Tradexus Times newsroom covers digital-asset markets, regulation and on-chain research — with every story connected to live market data.

Top Stories
The Desk

Live market intelligence snapshot

Crypto · trading 24/7 US stocks · closed
BitcoinBTC
Open profile
$82,709.28+2.00% 24h7d −1.19%
Low $79.8k$82.9k High
EthereumETH
Open profile
$2,480.83+4.81% 24h7d −1.60%
Low $2,324.22$2,494.00 High
Fear & Greed
63
Greed
Yesterday 53 · Neutral
Total market cap
$2.80T−0.29%24h
24h volume
$89.09B
Market shareBTC dominance
59.3%
BTC 59.3%ETH 10.8%Others 29.9%
Top 100 coins today
89 up7 down

Latest News

Market Movers

Live 24H changes
Top Gainers
Top Losers

Live Markets

Top 100 by market cap · prices update live
Watchlist Last 7 days

My Watchlist

Synced to your account when logged in
Push Notifications

Get a real notification on this device — even with the site closed — whenever we publish breaking news

Price Alerts

Get a browser notification when an asset hits your target

My Portfolio

Manual tracking — no wallet connection

Log in to track your holdings and see live profit/loss.

Compare Assets

Side-by-side, live data
Coins compared side by side: price, market cap, 24-hour volume, 24-hour range, distance from the all-time high and fully diluted value. The strongest value in each row is marked Leader.
Up to 3 coins, head to head

Pick any coin from the market list. The strongest value in each row is marked so you can read the winner at a glance.

Leader in the rowOthers, to scale
Add a coin
Add a coin
Add a coin
Live from Tradexus Data · prices in USD · Live · USDupdated just nowFull market table →Brightest bar = leader
Quick Convert

Economic Calendar

Date Country Event Impact Forecast Previous
Loading calendar…
Desk Research

Technical Analysis

Updated Daily

Correlation Matrix

How closely the largest coins move together

Each square compares two coins' hourly price moves. Near 1, they rise and fall together; near 0, they move independently.

Loading market data…

Sentiment Pulse

Derived from recent Tradexus Times coverage

—
Bullish 0%
Neutral 0%
Bearish 0%

Community Predictions

Daily price calls from our readers
Media & Learning

Education

@tradexustimes
Tradexus Times video
The Desk Behind The Desk

Our Team

Analysts, Editors & Quantitative Researchers
Dr. 3A
Chief Market Strategist

Specializing in macro-economic trends, institutional flows, and derivatives market structure.

Jason Garrity
Head of On-Chain Research

Expert in smart contract auditing, DeFi liquidity analytics, and Layer-2 scaling solutions.

Daniel Vance
Senior Technical Analyst

Focuses on order flow dynamics, price action models, and algorithmic trading strategies.

Elena Novak
Managing Editor

Oversees editorial integrity, investigative journalism, and policy impact reporting.

My Account
Tradexus Times