Markets expect the Fed to hold rates, but an unexpected hike could hit Bitcoin and risk assets. Oil near $115 and Israel’s election add fresh uncertainty to an already fragile market outlook.
MEXC reported an 88% monthly jump in AI-related trading volume in September, with strong growth across semiconductors, data centers, power equipment, tokenized stocks, and pre-IPO futures.
Bithumb reports a cyberattack on its internal employee system that exposed personal information, while no cryptocurrency losses have been reported. The breach adds to growing cybersecurity concerns across South Korea’s financial sector.
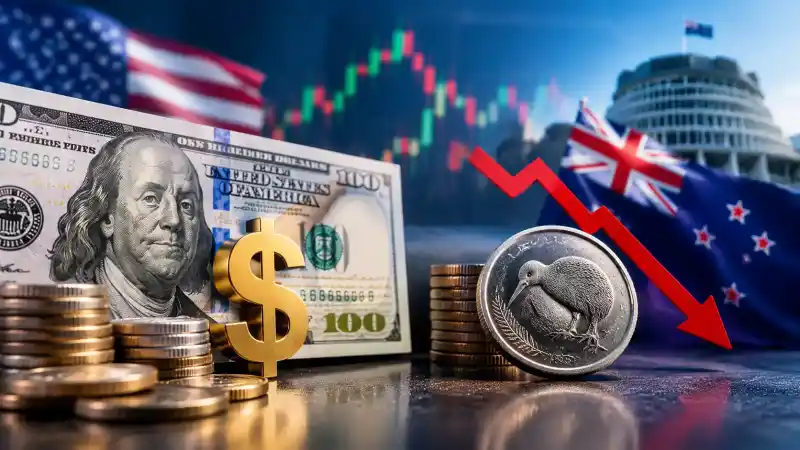
The dollar holds near a two-week high ahead of the Fed decision, while the New Zealand dollar drops after an unexpected rate hold. Australian inflation and upcoming central bank decisions keep markets on alert.
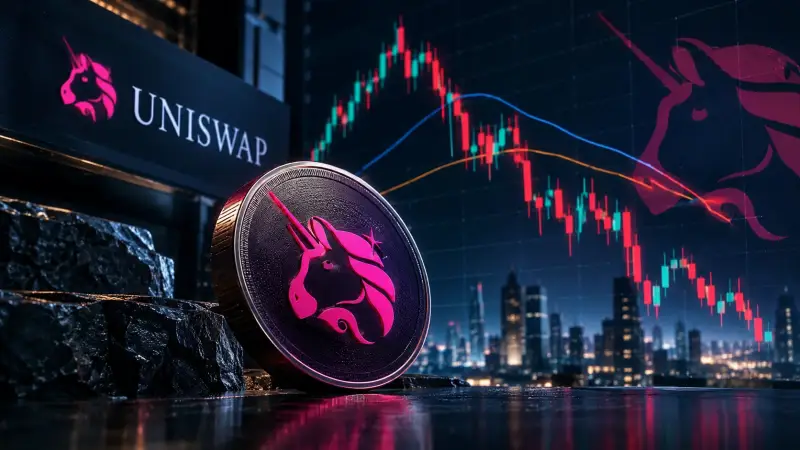
Uniswap’s UNI token has declined 26.94% over thirty days but remains 53.28% above its two-hundred-period moving average following an 81.38% ninety-day advance.
Nic Carter warns that quantum computing could threaten Bitcoin’s cryptographic security within a decade, increasing pressure for a transition to quantum-resistant signatures.
Breaking-news notificationsGet a notification on this device whenever we publish breaking news, even with the site closed.
My Portfolio
Holdings you add by hand · no wallet connection
Compare Assets
Side-by-side, live data
Coins compared side by side: price, market cap, 24-hour volume, 24-hour range, distance from the all-time high and fully diluted value. The strongest value in each row is marked Leader.
Up to 3 coins, head to head
Pick any coin from the market list. The strongest value in each row is marked so you can read the winner at a glance.
Leader in the rowOthers, to scale
+Add a coin
+Add a coin
+Add a coin
Live from Tradexus Data · prices in USD · Live · USDupdated just nowFull market table →Brightest bar = leader
Quick Convert
Macro
Economic Calendar
Date
Country
Event
Impact
Forecast
Previous
Loading calendar…
Desk Research
Technical Analysis
Updated every 4 hours
EMA 20EMA 50ResistanceSupportRSI 14
Daily indicatorsBTC / USD
EMA 20
$81,776
Price 0.8% below
EMA 50
$80,818
Price 0.4% above
EMA 200
$76,040
Price 6.7% above
RSI 14
47
Neutral
ATR 14
2.4%
Avg daily range
Volume
0.8×
24h vs 20-day avg
Share this snapshot
Download a branded image of the chart and key levels, or send the link.
Bitcoin trades between its key averages as momentum stays neutral
BTC is at $81,138, +1.7% in 24 hours and −3.5% over seven days. Price is caught between the 20- and 50-day averages, so the daily trend is undecided, while RSI at 47 is neutral. Resistance sits at $82,114, with support at $79,705.
BearishNeutralBullish
Mildly bullishscore +2 of ±5 · why ↓
▲Trend+2Between the 20- and 50‑day averages · above 200‑day
●Momentum0RSI 47 · MACD negative, recovering
●Positioning0Funding +0.005% · 67% long · balanced
●Sentiment0Fear & Greed 51 · Neutral
ResistanceR1 · +1.2%$82,114R2 · +4.4%$84,716
SupportS1 · −1.8%$79,705S2 · −5.8%$76,400
Key levels for Bitcoin
R2
$84,716
+4.4%
R1
$82,114
+1.2%
Price
$81,138
—
S1
$79,705
−1.8%
S2
$76,400
−5.8%
▲A daily close above $82,114 opens room toward $84,716.
▼Losing $79,705 on a daily close would put $76,400 in play.
Reviewed by Daniel Vance, Senior Technical Analyst
Correlation Matrix
How closely the largest coins move together
Each square compares two coins' hourly price moves. Near 1, they rise and fall together; near 0, they move independently.






 Jason Garrity

 Arthas Davidson