
 XRP

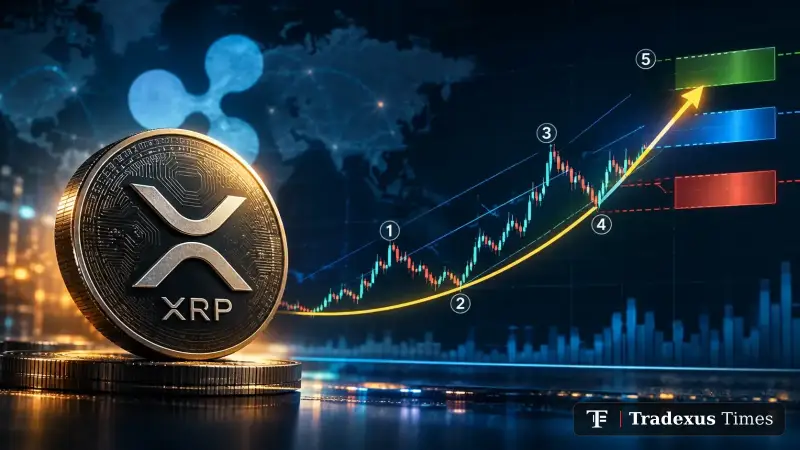
Crypto strategist EGRAG CRYPTO has outlined a long-term bullish projection for XRP based on Elliott Wave Theory, identifying a potential multiyear advance that could extend into the early next decade. The technical roadmap places XRP within Wave Three of a broader upward cycle, with projected targets ranging from double-digit prices to a higher-end bullish scenario.
The forecast combines a long-term wave count with Fibonacci retracement levels, measured-move projections and an ascending price channel. While the chart presents a structured bullish scenario, its targets remain conditional on XRP maintaining its broader technical formation and overcoming potential resistance along the way.
According to EGRAG CRYPTO’s interpretation, XRP completed a larger five-wave decline by 2020 before beginning a new five-wave upward sequence. The asset is now positioned within the third wave of that advance, which the analyst identifies as the cycle’s most significant potential expansion phase.
In Elliott Wave analysis, the third wave is often associated with a sustained directional move. However, identifying the correct wave count depends on how analysts interpret historical price action, making the projection a technical scenario rather than a confirmed path for the market.
The chart places XRP near the lower boundary of an ascending channel, alongside a curved long-term formation that EGRAG CRYPTO calls the “Nike Swoosh.” The pattern traces the asset’s decline and subsequent recovery, which the analyst interprets as a potential transition from accumulation toward expansion. Measured-move indicators extend previous price swings into future target areas, adding further projections to the overall structure.
The immediate technical reference points in the analysis are the support zones around $1.10 and $0.95. XRP was reported trading near $1.25 when the analysis was published, leaving the asset above both levels. A sustained break below the nearer support would weaken the short-term structure presented in the chart, while a decline through the lower zone would put additional pressure on the bullish interpretation.
On the upside, Fibonacci extensions and retracement levels help define the forecast’s projected trajectory. EGRAG CRYPTO identifies $5.43 as an important potential resistance area where selling pressure could interrupt the advance. Such a move would represent an intermediate test of the bullish thesis rather than confirmation that the higher targets are attainable.
The analyst’s main target region spans $11 to $13, while the higher-end scenario reaches $23 to $27. The chart also highlights $16.53 as a notable milestone, suggesting that many holders may take profits before a move reaches that level. These expectations reflect the analyst’s interpretation of potential market behavior; the source material does not establish investor positioning or demonstrate that holders would necessarily exit at those prices.
The scale of the projected advance makes the distinction between intermediate resistance and long-term targets particularly important. XRP would need to move through multiple price zones for the forecast to develop as outlined. Failure to sustain upward momentum at intermediate levels could delay or invalidate the projected sequence, while a confirmed move through resistance would provide stronger evidence that the market is following the proposed structure.
EGRAG CRYPTO maps the primary upward wave across the period from 2025 to 2029, with the wider Elliott Wave formation potentially completing around 2032. This extended timeline makes the projection more relevant as a long-term technical framework than as a near-term price forecast. The chart does not establish when individual targets would be reached or how the market would behave between them.
For market participants, the key question is whether XRP can preserve its broader ascending structure while progressing through the resistance zones identified in the analysis. The nearer support levels provide reference points for assessing downside risk, while the intermediate resistance area offers a test of whether the projected advance is gaining traction.
Ultimately, the forecast illustrates the potential upside implied by EGRAG CRYPTO’s wave count, but its reliability depends on the validity of the underlying technical interpretation and XRP’s subsequent price behavior. The higher targets remain speculative, and the projected timeline should not be treated as a guarantee of future performance.