

Shanghai Composite (SSEC) index
China market closed · Last trade
Shanghai Composite price chart
+0.80% · 5DShanghai Composite key stats
- Day range
- 3,590.80 – 3,686.17
- Previous close
- 3,603.50
- Open
- 3,602.84
- 52-week range
- 3,574.27 – 4,258.86
- 1 month change
- -3.59%
- 6 months change
- -9.62%
- 1 year change
- -6.92%
- Market
- China
- Exchange
- Shanghai
About Shanghai Composite
The Shanghai Composite is the main stock market index of China. Its level is in points. It last stood at 3,686.17, up 2.29% on the day.
Over the past 52 weeks it has moved between 3,574.27 and 4,258.86 — 13.4% below the high. Over the past year it is down 6.9%.
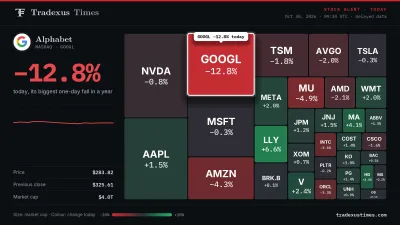
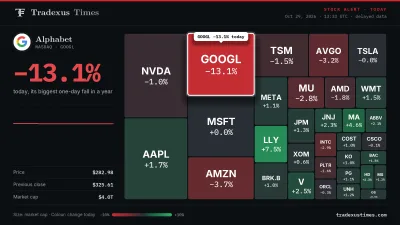
Big moves of the world’s main indices are covered by Tradexus Times market alerts.
Stories about Shanghai Composite will appear on this page as they are published.
Latest markets news
 InstitutionalBlackRock Sees No Change to Crypto Strategy After U.S. Midterm Elections
 StocksAsian Tech Stocks Slide Ahead of U.S. Midterms as AI and Chip Shares Come Under Pressure
 ETFBitcoin and Ethereum ETFs Record $635 Million in Weekly Outflows as Institutional Demand Weakens
 InstitutionalMicroStrategy May Announce New Bitcoin Purchase as Holdings Near $66 B
Shanghai Composite price FAQ
What is the Shanghai Composite today?
The Shanghai Composite last stood at 3,686.17 as of Nov 4, 2026 · 2:00 AM ET, up 2.29% from the previous close. Prices on this page come from third-party market data and may be delayed.
What is the 52-week high and low of Shanghai Composite?
Over the past 52 weeks it has been as high as 4,258.86 and as low as 3,574.27.
When is the Shanghai Composite updated?
While its stock market is open the level changes through the day; this page refreshes it every few minutes. Outside trading hours it shows the last close.
Is this page financial advice?
No. Prices and statistics are provided for information only and come from third-party market data. Do your own research before making any investment decision.
Prices and charts come from third-party market data and may be delayed. Information only — not financial advice. See our disclaimer.