HDFC Bank (HDB) stock price
US market closed · Last trade
HDFC Bank price chart
+12.64% · 5DHDFC Bank key stats
- Market cap
- $118.27B
- Volume
- 14.30M shares
- Day range
- $23.74 – $24.70
- Previous close
- $23.04
- Open
- $23.82
- 52-week range
- $21.36 – $37.35
- 1 month change
- +8.52%
- 6 months change
- -5.22%
- 1 year change
- -32.10%
- Exchange
- NYSE
- Sector
- Finance
- Industry
- Commercial Banks
- Listed since
- 2001
- Country
- India
About HDFC Bank
HDFC Bank (HDB) trades on NYSE. The stock last traded at $24.33, up 5.62% on the day, giving the company a market value of $118.27B. It is classed in the Finance sector (Commercial Banks).
Over the past 52 weeks it has traded between $21.36 and $37.35 — 34.9% below the high. Over the past year the price is down 32.1%.
Stories that mention HDFC Bank will appear on this page as they are published.
Latest stock market news
 InstitutionalBlackRock Sees No Change to Crypto Strategy After U.S. Midterm Elections
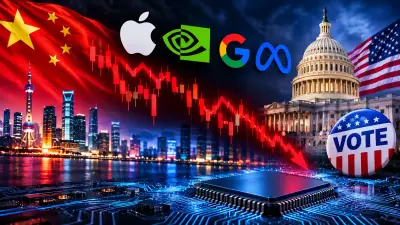 StocksAsian Tech Stocks Slide Ahead of U.S. Midterms as AI and Chip Shares Come Under Pressure
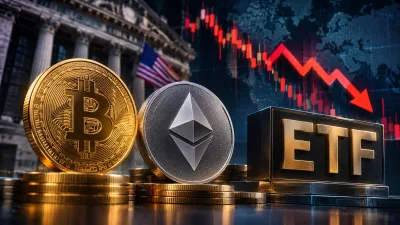 ETFBitcoin and Ethereum ETFs Record $635 Million in Weekly Outflows as Institutional Demand Weakens
 InstitutionalMicroStrategy May Announce New Bitcoin Purchase as Holdings Near $66 B
HDFC Bank stock FAQ
What is the HDFC Bank stock price today?
HDFC Bank (HDB) last traded at $24.33 as of Nov 4, 2026 · 4:00 PM ET, up 5.62% from the previous close. Prices on this page come from third-party market data and may be delayed.
What is HDFC Bank’s market cap?
HDFC Bank’s market capitalization is about $118.27B — the share price multiplied by the number of shares outstanding.
What is the 52-week high and low of HDB?
Over the past 52 weeks HDB has traded as high as $37.35 and as low as $21.36.
Where and when does HDB trade?
HDFC Bank trades on NYSE under the ticker HDB, in US dollars. Regular trading hours are 9:30 a.m. to 4:00 p.m. New York time, Monday to Friday, except US market holidays.
Is this page financial advice?
No. Prices and statistics are provided for information only and come from third-party market data. Do your own research before making any investment decision.
Stock prices, market caps and charts come from third-party market data and may be delayed. Information only — not financial advice. See our disclaimer.