Brent nears $115 as Middle East tensions threaten energy supplies and European protests highlight rising living costs. If major oil infrastructure is hit, crude could potentially reach $150, adding to inflation and market volatility.
Shiba Inu recovered to $0.00000510, but net exchange inflows of 53.8027 billion SHIB raised selling concerns. Price remains below the $0.00000525 resistance level as momentum and trading volume stay weak.
Crypto news corroboration ranged from about one hour for the Milei-LIBRA ruling to nearly 20 hours for Ethereum’s Glamsterdam delay and Bitcoin ETF outflows, highlighting differences in verification speed rather than market impact.
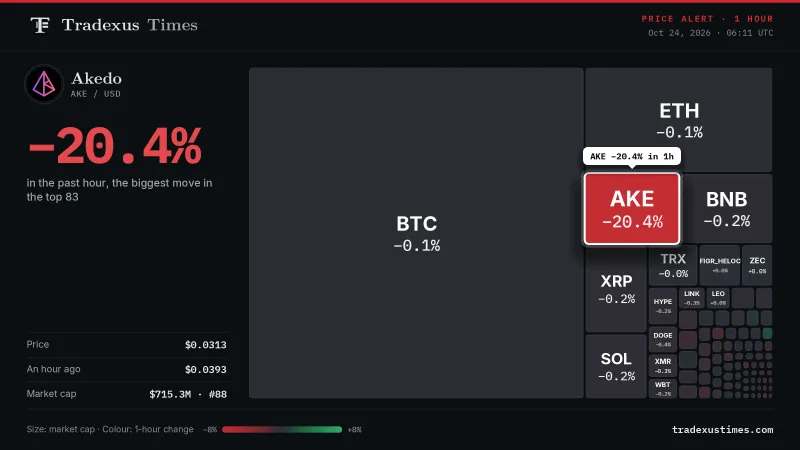
Akedo (AKE) dropped 20.4% to $0.0313 in the last hour, the steepest one‑hour move among the top 83 coins, while Bitcoin and Ether were flat to -0.1% over the same period.
Grayscale says crypto investors should weigh protocol earnings, buybacks and staking rewards against token issuance. Its framework highlights how supply inflation can erase otherwise attractive tokenholder returns.
An Argentine federal court cleared Javier Milei and other defendants in the Libra meme coin investigation, finding insufficient evidence of fraud or abuse of authority. Investors’ reported losses remain unresolved.
Breaking-news notificationsGet a notification on this device whenever we publish breaking news, even with the site closed.
My Portfolio
Holdings you add by hand · no wallet connection
Compare Assets
Side-by-side, live data
Coins compared side by side: price, market cap, 24-hour volume, 24-hour range, distance from the all-time high and fully diluted value. The strongest value in each row is marked Leader.
Up to 3 coins, head to head
Pick any coin from the market list. The strongest value in each row is marked so you can read the winner at a glance.
Leader in the rowOthers, to scale
+Add a coin
+Add a coin
+Add a coin
Live from Tradexus Data · prices in USD · Live · USDupdated just nowFull market table →Brightest bar = leader
Quick Convert
Macro
Economic Calendar
Date
Country
Event
Impact
Forecast
Previous
Loading calendar…
Desk Research
Technical Analysis
Updated every 4 hours
EMA 20EMA 50ResistanceSupportRSI 14
Daily indicatorsBTC / USD
EMA 20
$82,353
Price 1.6% below
EMA 50
$80,860
Price 0.2% above
EMA 200
$75,904
Price 6.8% above
RSI 14
45
Soft momentum
ATR 14
2.5%
Avg daily range
Volume
0.7×
24h vs 20-day avg
Share this snapshot
Download a branded image of the chart and key levels, or send the link.
Bitcoin trades between its key averages as momentum weakens
BTC is at $81,043, −0.7% in 24 hours and −0.5% over seven days, on lighter volume than usual. Price is caught between the 20- and 50-day averages, so the daily trend is undecided, while RSI at 45 shows momentum is soft. Resistance sits at $82,114, with support at $79,971.
BearishNeutralBullish
Mildly bullishscore +1 of ±5 · why ↓
▲Trend+2Between the 20- and 50‑day averages · above 200‑day
▼Momentum−1RSI 45 · MACD negative, falling
●Positioning0Funding +0.007% · 68% long · balanced
●Sentiment0Fear & Greed 51 · Neutral
ResistanceR1 · +1.3%$82,114R2 · +4.3%$84,534
SupportS1 · −1.3%$79,971S2 · −5.7%$76,400
Key levels for Bitcoin
R2
$84,534
+4.3%
R1
$82,114
+1.3%
Price
$81,043
—
S1
$79,971
−1.3%
S2
$76,400
−5.7%
▲A daily close above $82,114 opens room toward $84,534.
▼Losing $79,971 on a daily close would put $76,400 in play.
Reviewed by Daniel Vance, Senior Technical Analyst
Correlation Matrix
How closely the largest coins move together
Each square compares two coins' hourly price moves. Near 1, they rise and fall together; near 0, they move independently.





 SHIB
 Arthas Davidson


 AKE