
StocksNews

Wall Street Suffers a Brutal Sell-Off as Iran War Uncertainty and AI Fears Shake Markets

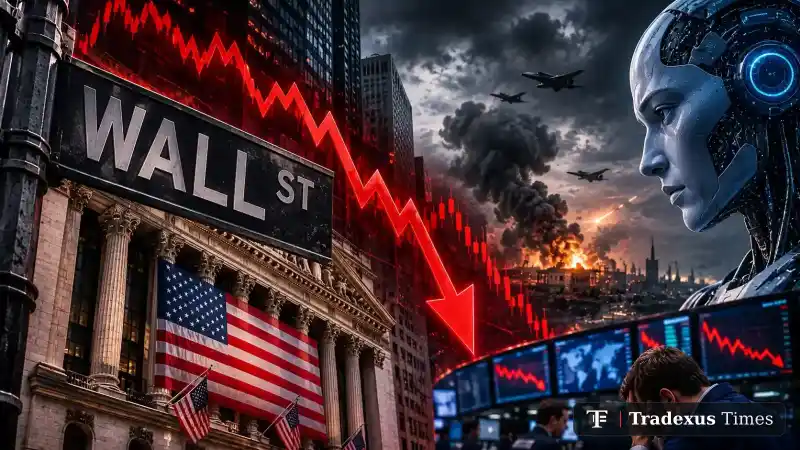
Wall Street plunged on Thursday as the S&P 500 fell 3.2%, the Dow lost 1,079 points and the Nasdaq dropped 4.9%. AI stocks led the sell-off as Iran war uncertainty added pressure to markets.

Dr. Sarah Mitchell
By Market Analyst 2 min read
Summarize this story3 key points · 20-second readThe key points in 20 seconds
  • The S&P 500 fell 3.2%, the Dow Jones dropped 1,079 points, and the Nasdaq slid 4.9%, the steepest S&P decline since the 2025 tariff turmoil.
  • AI and semiconductor stocks led the sell‑off, with Nvidia down 6.3%, AMD down 13.1% and CoreWeave down 10%.
  • Brent crude rose 2.5% to about $96.95 a barrel as uncertainty over the Iran war lingered.

Why it matters: These moves show how geopolitical tension and AI investment concerns are simultaneously pressuring major indexes and energy prices, directly affecting investors’ portfolios.

Summary written with AI and checked by Tradexus editors.

Wall Street Suffers a Brutal Sell-Off as Iran War Uncertainty and AI Fears Shake Markets

Wall Street experienced a sharp reversal on Thursday as U.S. stocks plunged, wiping out the previous session's strong rally and reigniting concerns about the economic consequences of the Iran war and growing uncertainty across financial markets.

The S&P 500 dropped 3.2%, marking its steepest daily decline since the market turmoil triggered by President Donald Trump's tariff announcements in 2025. The Dow Jones Industrial Average plunged 1,079 points, while the technology-heavy Nasdaq Composite fell 4.9%. The scale of the decline turned Thursday into one of the most difficult trading sessions for U.S. investors in recent months.

In this story

3 assets
S&P 500SPXIndex · SNP · In this story
7,427.81−3.39% · 1d
5d −2.72%MCap —Vol 2.14B
Open SPX page

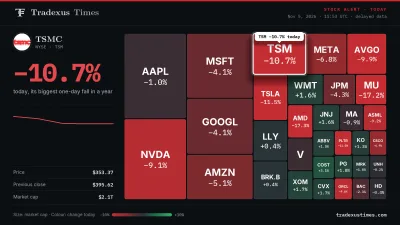
However, the sell-off was not driven by geopolitical concerns alone. Artificial intelligence and semiconductor stocks were at the center of the market downturn. Nvidia shares fell 6.3%, Advanced Micro Devices plunged 13.1%, and cloud-computing company CoreWeave lost 10%. Growing concerns about the cost of financing AI infrastructure and the possibility of restrictions on new data-center construction intensified selling pressure.

The political consequences of the U.S. midterm elections have also become part of the market equation. Democratic victories have raised the possibility of increased government scrutiny of AI infrastructure projects, potentially slowing the expansion of data centers. Investors are now reassessing the outlook for companies that have attracted enormous valuations based on expectations of continued AI investment.

The latest decline also erased the optimism that had lifted Wall Street during Wednesday's trading session, when the Dow surged more than 1,500 points following the election results. That rally had been supported by hopes that political uncertainty would ease and that the change in congressional power could increase pressure for a resolution to the Iran conflict.

Meanwhile, developments in the Middle East continue to influence energy markets. Brent crude rose 2.5% on Thursday to approximately $96.95 per barrel, recovering part of its sharp decline in the previous session. Uncertainty over the duration of the Iran war and the potential disruption of global energy supplies remains a significant concern for investors.

The combination of geopolitical risks, elevated energy prices and pressure on high-valued technology companies has created a difficult environment for financial markets. Higher energy costs could reinforce inflationary pressure, while expensive borrowing conditions may make it harder for technology companies to sustain their massive investment plans.

Although reports have pointed to losses exceeding $1 trillion in previous technology-sector sell-offs, the latest available market figures do not independently confirm that Wall Street lost more than $1 trillion in total market capitalization during Thursday's session. What is clear is that the major U.S. indexes suffered substantial declines, with AI-related stocks accounting for a significant share of the damage.

For investors, the central question is whether Thursday's collapse represents a temporary correction in technology valuations or the beginning of a broader period of market instability. The direction of oil prices, developments in the Iran conflict and the future of AI investment will remain among the most important factors shaping Wall Street's next moves.

Share
Newsletter

Get the Tradexus Briefing

The day’s most important crypto stories in one short email, once a day. Free — unsubscribe any time.

Dr. Sarah Mitchell
About the authorDr. Sarah MitchellMarket Analyst

Market analyst and crypto researcher with 6+ years of experience in blockchain and digital assets. Sharing insights, trends, and data-driven analysis.

Breaking
The Desk

Live market intelligence snapshot

Crypto · trading 24/7 US stocks · closed
Bitcoin logo
BitcoinBTC
Open profile
$76,035.67−5.34% 24h7d −6.42%
Low $75.6k$81.0k High
Ethereum logo
EthereumETH
Open profile
$2,252.42−7.11% 24h7d −4.28%
Low $2,236.78$2,444.75 High
Fear & Greed
50
Neutral
Yesterday 34 · Fear
Total market cap
$2.59T−6.84%24h
24h volume
$92.36B−1.72%vs yesterday
Market shareBTC dominance
59.2%
BTC 59.2%ETH 10.7%Others 30.1%
Top 100 coins today
21 up76 down

Latest News

Updated 5m ago
Showing 0 of 0 stories

Market Movers

Live 24H changes
Top Gainers
Top Losers

Live Markets

Top 100 by market cap · prices update live
Watchlist Last 7 days

My Watchlist

Crypto and stocks you follow, live
Breaking-news notificationsGet a notification on this device whenever we publish breaking news, even with the site closed.

My Portfolio

Holdings you add by hand · no wallet connection

Compare Assets

Side-by-side, live data
Coins compared side by side: price, market cap, 24-hour volume, 24-hour range, distance from the all-time high and fully diluted value. The strongest value in each row is marked Leader.
Up to 3 coins, head to head

Pick any coin from the market list. The strongest value in each row is marked so you can read the winner at a glance.

Leader in the rowOthers, to scale
Add a coin
Add a coin
Add a coin
Live from Tradexus Data · prices in USD · Live · USDupdated just nowFull market table →Brightest bar = leader
Quick Convert
Macro

Economic Calendar

Date Country Event Impact Forecast Previous
Loading calendar…
Desk Research

Technical Analysis

Updated Daily

Correlation Matrix

How closely the largest coins move together

Each square compares two coins' hourly price moves. Near 1, they rise and fall together; near 0, they move independently.

Loading market data…

Sentiment Pulse

Derived from recent Tradexus Times coverage

—
—
0%
0%
0%
Bullish 0 Neutral 0 Bearish 0
Story by storyTap a block to read
NewestOldest

Community Predictions

Daily price calls from our readers
Media & Learning

Education

@tradexustimes
Tradexus Times video
The Desk Behind The Desk

Our Team

Analysts, Editors & Quantitative Researchers
Tradexus TimesStaff · 01

Dr. 3A

Chief Market Strategist

Specializing in macro-economic trends, institutional flows, and derivatives market structure.

Tradexus TimesStaff · 02

Jason Garrity

Head of On-Chain Research

Expert in smart contract auditing, DeFi liquidity analytics, and Layer-2 scaling solutions.

Tradexus TimesStaff · 03

Daniel Vance

Senior Technical Analyst

Focuses on order flow dynamics, price action models, and algorithmic trading strategies.

Tradexus TimesStaff · 04

Elena Novak

Managing Editor

Oversees editorial integrity, investigative journalism, and policy impact reporting.