French 10‑Year Yield Climbs to 4.85% as France‑Germany Spread Hits 145 Bps

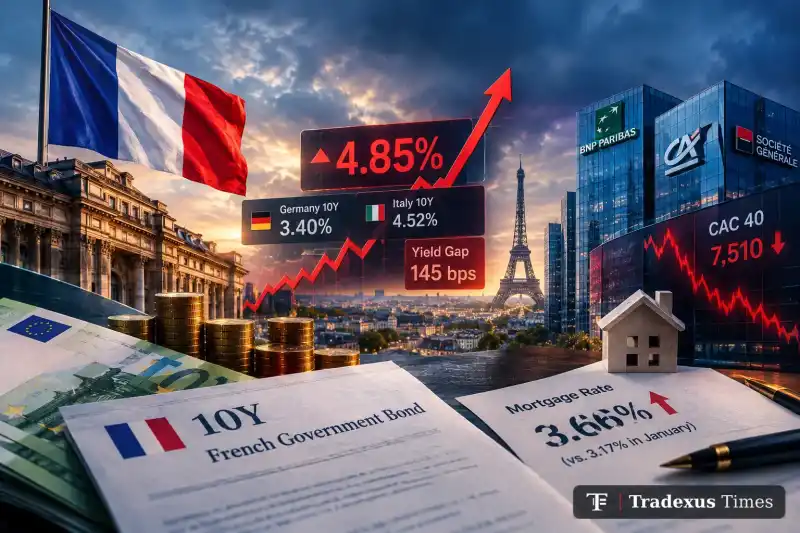
French 10‑year government bond yields jumped to about 4.85% on Monday, widening the France‑Germany spread to roughly 145 basis points and pushing the CAC 40 below key support.

By Tradexus News Desk 2 min read
Summarize this story3 key points · 15-second readThe key points in 15 seconds
  • French 10‑year yield rose to about 4.85%, the biggest G7 increase.
  • France‑Germany 10‑year spread widened to roughly 145 basis points.
  • CAC 40 fell below 7,890 support; major French banks dropped over 2%.

Why it matters: The surge in French sovereign yields signals heightened fiscal risk and market anxiety, which is depressing French equities and raising borrowing costs for households and banks.

Summary written with AI and checked by Tradexus editors.

French 10‑Year Yield Climbs to 4.85% as France‑Germany Spread Hits 145 Bps

French 10‑year government bond yields rose to approximately 4.85% on Monday, the steepest increase among G7 sovereigns, widening the yield gap with German 10‑year bonds to about 145 basis points.

The higher French yield now exceeds Italy’s 10‑year rate of roughly 4.52%, marking the first time France’s borrowing cost has overtaken its southern European counterpart, a development linked to heightened fiscal concerns and recent civil unrest.

France’s fiscal outlook remains strained, with the deficit projected at 5.4% of GDP for the year—well above the EU’s 3% ceiling—and Prime Minister Sébastien Lecornu seeking €54 billion in savings for the 2027 budget, factors that have pressured sovereign pricing.

The market reaction extended to equities, as the CAC 40 slipped back below the 7,890 support level and approached the next support zone near 7,510, while major French banks—including BNP Paribas, Crédit Agricole, and Société Générale—each fell more than 2%.

Mortgage markets also felt the pressure; the average 20‑year French mortgage rate rose to 3.66% in October from 3.17% earlier in the year, reflecting broader financing cost increases for households.

This story was compiled by the Tradexus News Desk with the help of AI.

Share
Newsletter

Get the Tradexus Briefing

The day’s most important crypto stories in one short email, once a day. Free — unsubscribe any time.

Published by Tradexus TimesTradexus News Desk

The Tradexus Times newsroom covers digital-asset markets, regulation and on-chain research — with every story connected to live market data.

Top Stories
The Desk

Live market intelligence snapshot

Crypto · trading 24/7 US stocks · closed
BitcoinBTC
Open profile
$81,715.84−0.60% 24h7d +0.23%
Low $81.5k$83.2k High
EthereumETH
Open profile
$2,400.51−0.41% 24h7d −1.68%
Low $2,385.18$2,446.27 High
Fear & Greed
55
Greed
Yesterday 59 · Greed
Total market cap
$2.75T−2.36%24h
24h volume
$69.72B−99.85%vs yesterday
Market shareBTC dominance
59.5%
BTC 59.5%ETH 10.6%Others 29.8%
Top 100 coins today
50 up46 down

Latest News

Market Movers

Live 24H changes
Top Gainers
Top Losers

Live Markets

Top 100 by market cap · prices update live
Watchlist Last 7 days

My Watchlist

Synced to your account when logged in
Push Notifications

Get a real notification on this device — even with the site closed — whenever we publish breaking news

Price Alerts

Get a browser notification when an asset hits your target

My Portfolio

Manual tracking — no wallet connection

Log in to track your holdings and see live profit/loss.

Compare Assets

Side-by-side, live data
Coins compared side by side: price, market cap, 24-hour volume, 24-hour range, distance from the all-time high and fully diluted value. The strongest value in each row is marked Leader.
Up to 3 coins, head to head

Pick any coin from the market list. The strongest value in each row is marked so you can read the winner at a glance.

Leader in the rowOthers, to scale
Add a coin
Add a coin
Add a coin
Live from Tradexus Data · prices in USD · Live · USDupdated just nowFull market table →Brightest bar = leader
Quick Convert

Economic Calendar

Date Country Event Impact Forecast Previous
Loading calendar…
Desk Research

Technical Analysis

Updated Daily

Correlation Matrix

How closely the largest coins move together

Each square compares two coins' hourly price moves. Near 1, they rise and fall together; near 0, they move independently.

Loading market data…

Sentiment Pulse

Derived from recent Tradexus Times coverage

—
Bullish 0%
Neutral 0%
Bearish 0%

Community Predictions

Daily price calls from our readers
Media & Learning

Education

@tradexustimes
Tradexus Times video
The Desk Behind The Desk

Our Team

Analysts, Editors & Quantitative Researchers
Dr. 3A
Chief Market Strategist

Specializing in macro-economic trends, institutional flows, and derivatives market structure.

Jason Garrity
Head of On-Chain Research

Expert in smart contract auditing, DeFi liquidity analytics, and Layer-2 scaling solutions.

Daniel Vance
Senior Technical Analyst

Focuses on order flow dynamics, price action models, and algorithmic trading strategies.

Elena Novak
Managing Editor

Oversees editorial integrity, investigative journalism, and policy impact reporting.

My Account
Tradexus Times